
The 4% Problem: Why Almost No Support Team Achieves AI ROI (And How to Join Them)
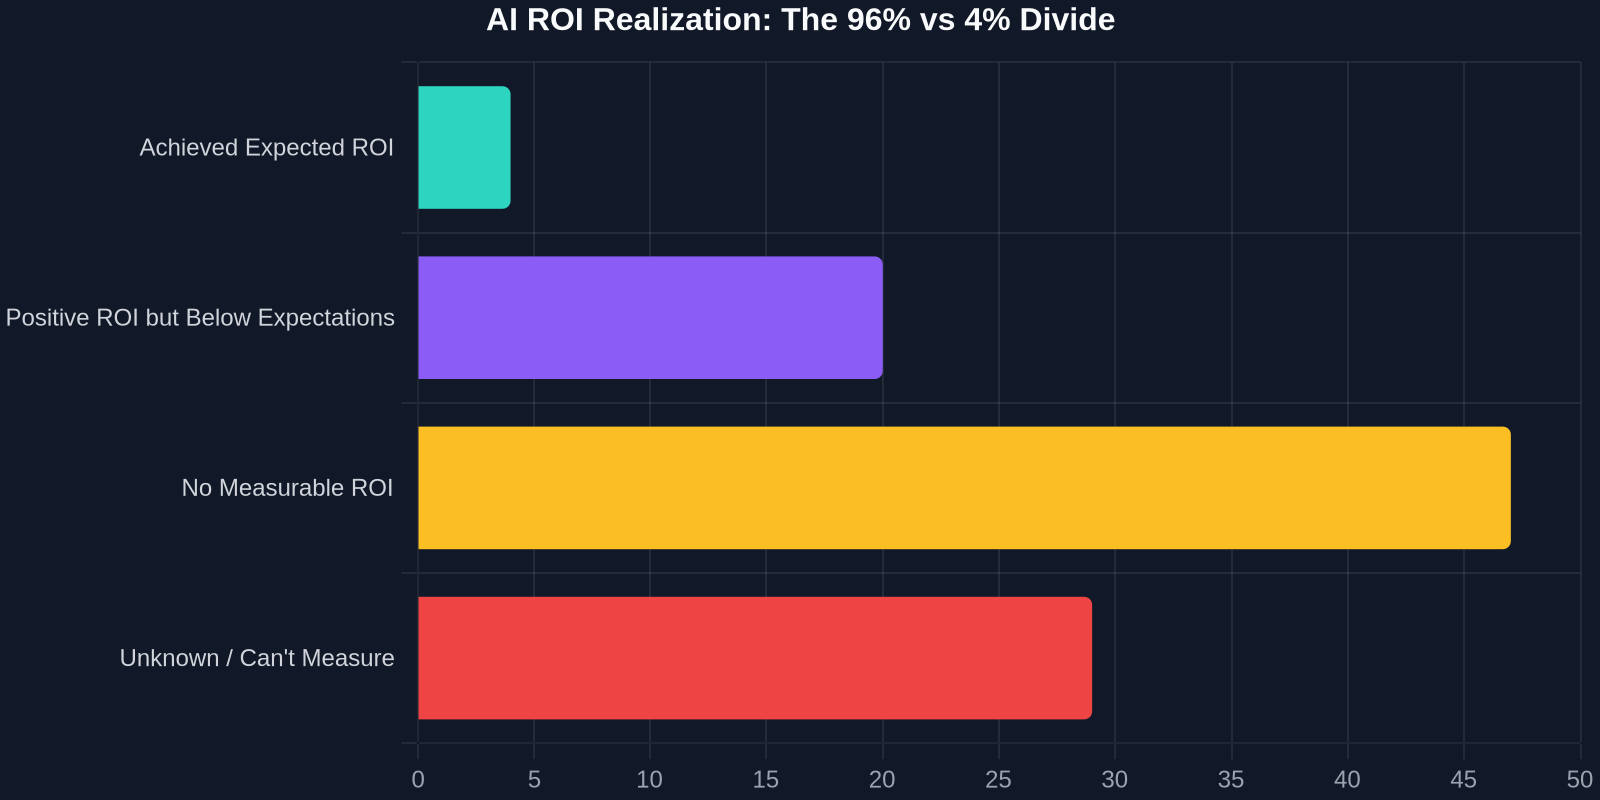
The headline from a recent Customer Experience Dive report should give every support leader pause: only 4% of customer service teams have achieved their expected ROI from AI. Not 40%. Four percent. In an era where AI is dominating boardroom conversations and dominating budget allocations, this statistic isn't just a wake-up call, it's a declaration that the vast majority of teams are fundamentally measuring the wrong things.
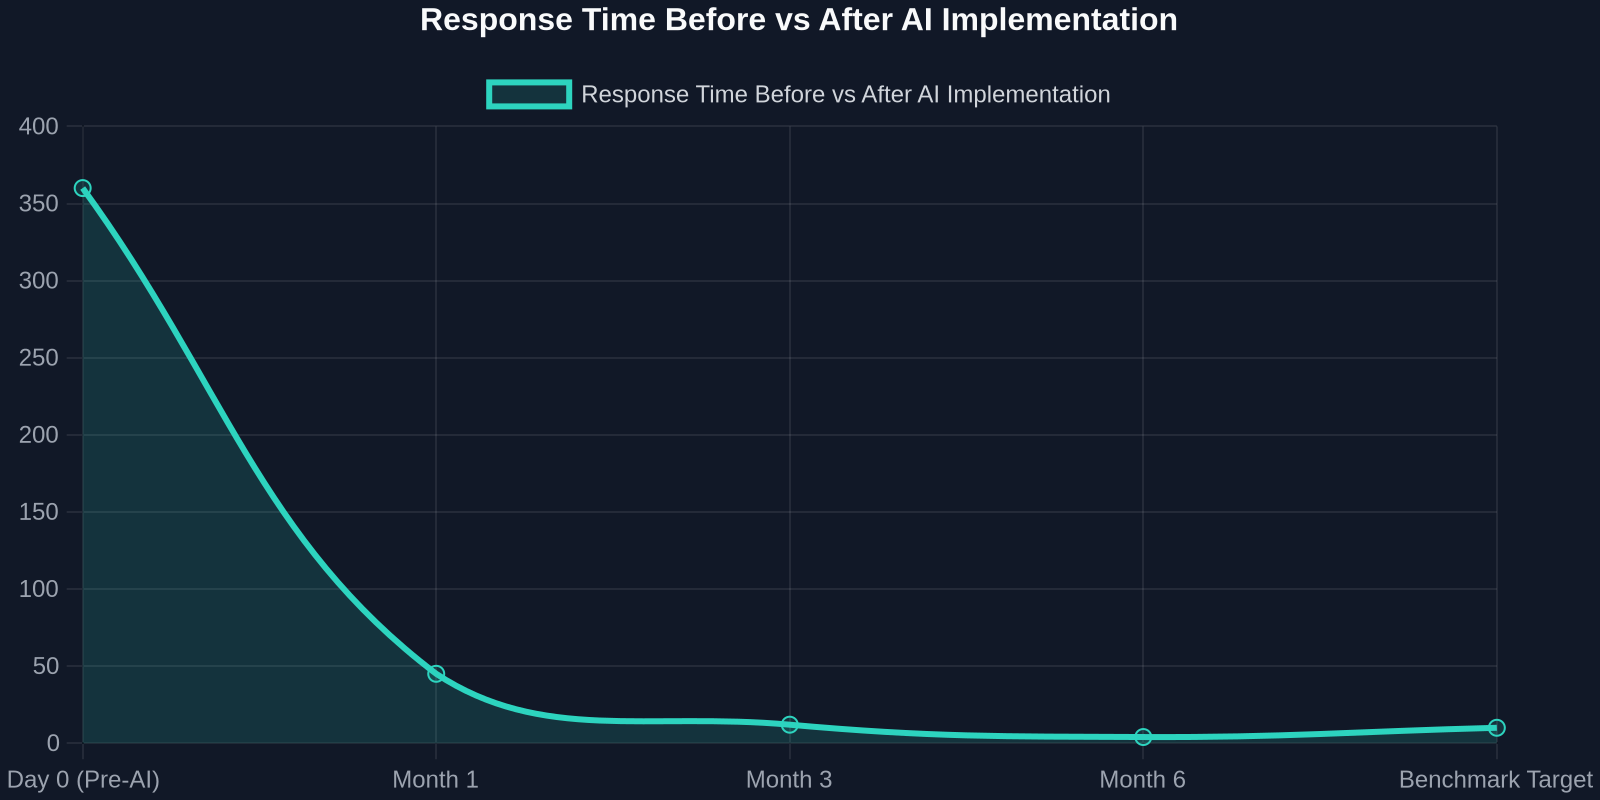
Meanwhile, the teams who do crack the code aren't just saving money. According to Freshworks' 2025 benchmark report, they're slashing first response times from over 6 hours to under 4 minutes, a 55% reduction that fundamentally changes customer relationships. So what separates the 4% from the 96%? The answer lies in a fundamental shift from measuring AI activity to measuring AI business value.
The ROI Illusion: Counting Features Instead of Value
Walk into any support ops meeting, and you'll hear the same vanity metrics: number of AI interactions, ticket deflection rate, articles suggested. These are activity metrics. They tell you what your AI did. They don't tell you what your AI created. IBM Institute for Business Value research captures this schizophrenia perfectly: 79% of executives report seeing productivity gains from AI, yet only about 29% can measure its ROI confidently. There's a massive gap between perceived value and proven value.
This gap exists because most teams confuse implementation with impact. They measure the cost of AI, the license fees, the integration expenses, the training hours. But they fail to quantify the return in financial terms that the CFO actually cares about. A Gartner survey revealed that service leaders are spending a median of 12% of their 2025 budgets on AI; that's a significant investment that demands rigorous financial accountability, not just ticket-counting.
The 4% who succeed do something radically different: they build a bridge between AI operations and financial outcomes using a specific set of value metrics with clear formulas and data sources. They don't report that an AI agent "handled 5,000 conversations." They report that AI generated $340,000 in operational savings while simultaneously increasing customer retention by 3 points.
The 16 Metrics That Actually Measure AI Value
Moving from activity to value requires a new measurement framework. The magic isn't in choosing one perfect KPI, it's in building a dashboard that connects AI actions to business outcomes. Here are the 16 AI value metrics the top-performing 4% use, organized by business function.

Operational Efficiency Metrics
These metrics translate AI activity into financial impact for your support operations:
- Cost Per Ticket Avoided: This isn't just deflection rate. Calculate (Total AI Cost / AI-Resolved Tickets) vs (Average Human Cost / Ticket). Formula: Human CPT minus AI CPT, multiplied by AI-resolved volume.
- Agent Utilization Rate: Measure productive agent time before and after AI. If agents previously spent 4 hours/day on tier-1 triage and now spend 1, you've recovered 3 hours per agent per day for work that drives retention and expansion revenue.
- Full Resolution Rate (FRR): Track what percentage of AI-handled conversations require zero human intervention. Many teams boast high deflection but fail to measure whether customers bounce back with the same issue. The 4% target FRR above 70%.
- Time-to-Value Acceleration: For AI knowledge base content, measure the gap between publication date and first measurable ticket reduction. Top teams compress this to under 72 hours through proactive deployment strategies.
| Measurement Approach | 96% of Teams (Activity Focus) | 4% of Teams (Value Focus) |
|---|---|---|
| Primary Metric | Tickets deflected | Cost per ticket avoided |
| Success Definition | AI handled 40% of volume | AI reduced cost-to-serve by 35% |
| Reporting Frequency | Monthly volume dashboards | Weekly P&L impact analysis |
| Reinvestment Strategy | Reduce headcount by equivalent volume | Upskill agents to revenue-generating roles |
Customer Experience Metrics
Efficiency means nothing if it erodes your customer relationships. The 4% layer in experience metrics that validate quality alongside speed:
- AI Interaction CSAT: Don't just ask "was this helpful?" Ask "did this resolve your issue completely?" The difference between a 4/5 and a 5/5 on this specific question correlates directly with retention probability.
- Response Time Reduction: Freshworks' 2025 benchmark data shows a jump from 6 hours to under 4 minutes. But the business metric isn't the time itself, it's the revenue recovered from customers who would have churned during those 5 hours and 56 minutes of silence.
- Sentiment Recovery Rate: Measure conversations where AI detects negative sentiment and successfully de-escalates without human handoff. This metric directly predicts customer lifetime value protection.
- Re-contact Rate by Channel: Track how often AI-resolved customers re-engage within 7 days. A high rate indicates your AI is treating symptoms, not root causes.
Financial Performance Metrics
This is where the 4% separate themselves definitively. They speak in the language of the CFO:
- AI Gross Margin Contribution: (Revenue Protected by AI + Cost Saved by AI) / Total AI Investment. This single ratio tells your leadership whether AI is a net profit center or a net cost center.
- Customer Acquisition Cost (CAC) Offset: When AI-powered support generates reviews, referrals, or case study candidates, attribute that value back to the AI investment. A single case study that influences a $100K deal changes the ROI equation dramatically.
- Support-Generated Expansion Revenue: In the old model, agents were too busy triaging to identify upsell opportunities. AI frees them. Track net-new expansion revenue from agent conversations that wouldn't have happened without AI handling tier-1 volume.
- Employee Retention Value: Agent turnover costs 6-9 months of salary. If AI reduces burnout by eliminating repetitive tier-1 work, and your attrition drops from 25% to 15%, multiply that by your average replacement cost.
Strategic and Knowledge Metrics
The most mature AI implementations measure the compounding returns of organizational learning:
- Knowledge Base Acceleration Factor: Measure how much faster your knowledge base grows and improves when AI surfaces content gaps from real conversations. Top teams see 3x faster article creation.
- AI Learning Velocity: Track the week-over-week improvement in AI resolution rates. A flat line indicates your AI isn't learning from interactions, which means you've bought an expensive script-bot, not an intelligent system.
- Strategic Initiative Enablement: If AI handles 50% of routine inquiries, your team can now launch that proactive customer health program. Quantify the projected value of that new initiative and attribute a portion to AI's enablement.
- Data Asset Value: Every AI interaction generates structured data about customer needs, product gaps, and sentiment trends. If your product team uses that data to inform roadmap decisions that generate revenue, that's AI ROI.
"Most teams can tell you what AI costs and not what it returns. The gap between implementing AI and proving its value is a measurement gap, not a technology gap."
The Integration Gap: Why AI Outpaces Your People
While the measurement challenge is central, it's compounded by a deeper structural issue. A recent report found that only 4% of midsize companies say AI and workforce transformation are moving forward as integrated efforts. AI is racing ahead of people. Organizations deploy the technology but fail to redesign the workflows, roles, and success criteria around it.
This creates a devastating dynamic: your AI is answering tickets faster, but your agents are still measured on ticket volume. Your AI is identifying churn risks, but your CSMs still operate on a calendar-based outreach schedule. The technology changes, but the operating system doesn't. The result is that AI becomes an expensive overlay rather than a transformational foundation.
The integration gap is one reason why only 6.5% of organizations measure AI ROI against defined benchmarks, according to the Fourth Annual Basis Report. Without benchmarks, you don't actually know if 15% deflection is good or if it should be 45%. You're flying blind, celebrating activity that may represent significant underperformance against what your tech stack can actually achieve.
The Agent Cost Equation: Beyond the License Fee
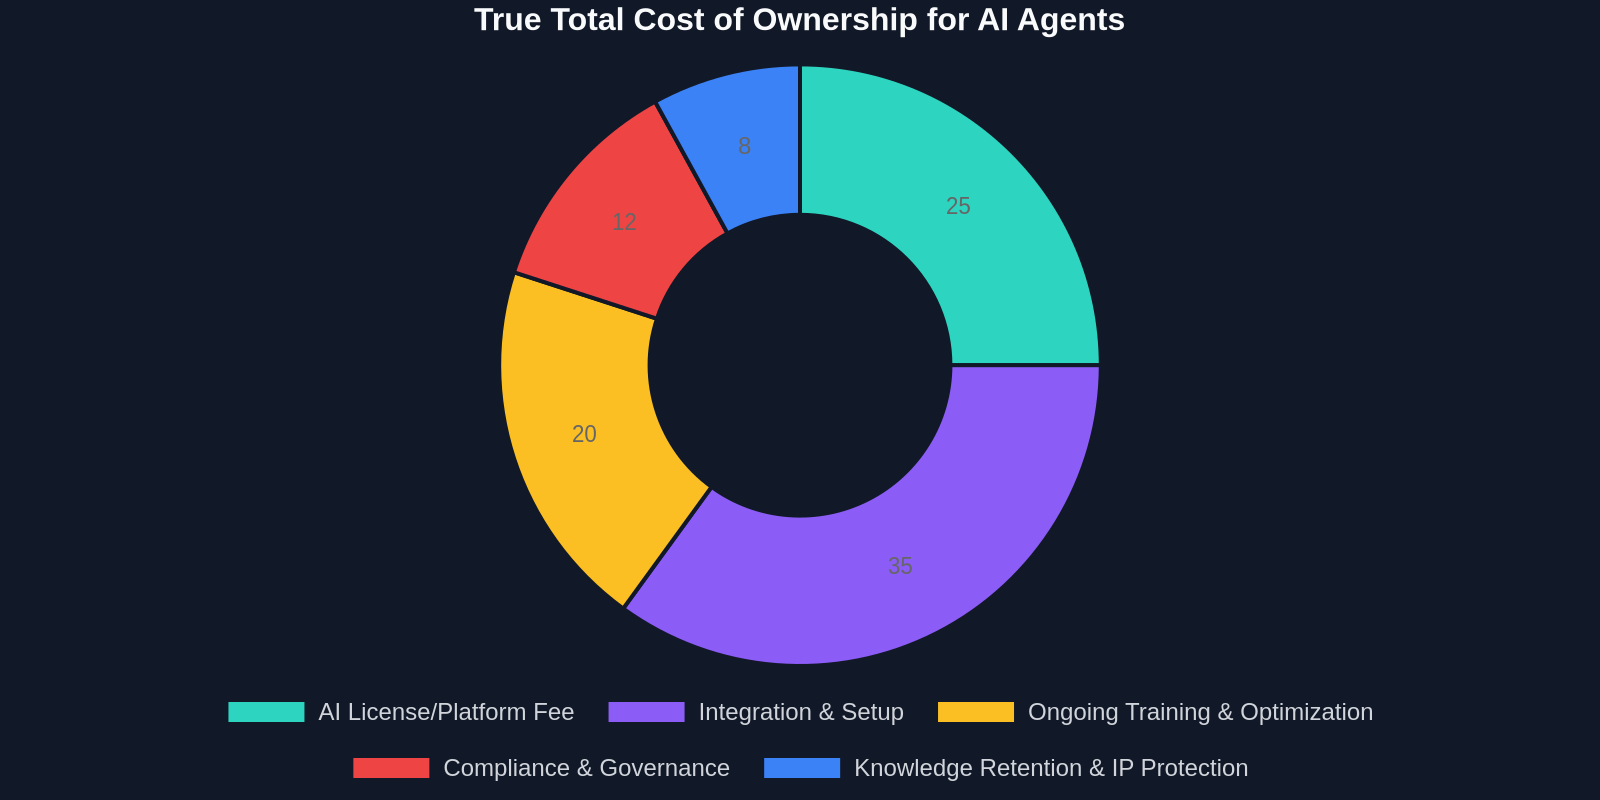
Another hidden dimension of AI ROI is the true total cost of AI agents. When support leaders evaluate AI, they often compare a per-agent SaaS seat (say, $150/month) against a per-conversation AI cost. But this comparison is dangerously incomplete. The real AI agent cost equation includes:

- Implementation and Integration Costs: Custom API development, data cleaning for training, SSO configuration, these one-time costs can be 3-5x the first-year license fee.
- Ongoing Training and Optimization: AI isn't "set and forget." It requires knowledge base curation, content creation for new product launches, and prompt engineering update cycles.
- Compliance and Governance Overhead: In regulated industries, every AI response needs documented controls. This overhead scales with conversation volume.
- Owned vs. Metered AI Costs: Metered pricing looks cheap until your conversation volume spikes. Owned infrastructure has higher upfront costs but protects your unit economics at scale, and crucially, keeps your business knowledge inside your walls, avoiding vendor lock-in.
Sophisticated teams evaluate total cost per resolution over a 3-year horizon, accounting for volume growth, seasonal spikes, and the platform's ability to retain business knowledge through personnel changes. They build ROI models that assume the AI will handle more volume over time as your knowledge base matures, and they include the cost of that maturation in the initial business case.
| Cost Factor | Basic Budget Evaluation | Comprehensive 3-Year TCO |
|---|---|---|
| AI License | Primary consideration | 20-30% of total cost |
| Integration | Often forgotten | 2-5x first-year license |
| Ongoing Training | Assumed 'free' | Dedicated 0.5 FTE minimum |
| Compliance | Ignored until audit | Built into monthly cost model |
| Vendor Lock-in Risk | Not measured | Calculated as switching cost probability |
A Framework for Joining the 4%: The Value Translation Protocol
Bridging the gap from the 96% to the 4% requires a systematic approach to translating AI activity into financial outcomes. We call this the Value Translation Protocol, and it operates in four phases.
Phase 1: Define Your Financial North Star
Begin with the end in mind. Ask your CFO what metric would make them consider the AI investment a success. Is it a reduction in cost-to-serve per customer? Is it an increase in net revenue retention through improved support experiences? Is it margin expansion that allows reinvestment in product? Your AI metrics must ladder up to this specific financial outcome, not to a generic "efficiency" goal. If your CFO's North Star is operating margin, then your AI success metric should be "AI contribution to gross margin percentage" shown quarterly.
Phase 2: Build Your Measurement Bridge
For each financial outcome, map the operational metrics that drive it. If your North Star is margin expansion, you need to measure: (a) labor cost displacement from AI-handled tickets, (b) retention improvement from faster response times, (c) expansion revenue from freed agent capacity, and (d) avoided compliance penalties from AI consistency. Each of these needs a formula and a data source that your CFO can audit. The 4% of teams that succeed have this bridge documented in a shared spreadsheet that finance, support ops, and the AI vendor all agree upon before deployment begins.
Phase 3: Benchmark Ruthlessly
You cannot know if your ROI is good in a vacuum. The Freshworks benchmark showing a 55% reduction in response time is useful because it sets an expectation. But you need internal benchmarks too. Before AI deployment, establish a 3-month rolling baseline for every metric you plan to claim AI will improve. If you don't have a baseline, you can't prove improvement. The 96% often skip this step and then resort to anecdotes when the CFO asks for ROI evidence.
Phase 4: Create a Continuous Value Audit Rhythm
ROI isn't a one-time proof; it's an ongoing evidence stream. The 4% run monthly value audits where they compare actual AI outcomes against the business case assumptions. When AI underperforms on a metric, say, full resolution rate dips below 70%, they have a pre-agreed action plan: audit the knowledge base, retrain the model on recent conversation data, or adjust routing logic. When AI overperforms, they have a plan to reinvest gains: perhaps pulling forward the next phase of automation or expanding into a new channel. This rhythm prevents the slow ROI erosion that happens when AI performance drifts and nobody is watching.
"79% of executives see productivity gains from AI. Only 29% can measure ROI confidently. The 50-point gap is where careers are made, or broken, in support leadership."
The Netflix Lesson: Consumer AI Expectations Are Reshaping B2B Standards
An interesting parallel exists in how consumer AI is setting the bar. Netflix's new AI Discover tool reveals a counter-intuitive truth: consumers don't want AI to replace their judgment; they want AI to make their judgment faster and more informed. In support, the parallel is precise. Customers don't want an AI that pretends to be human. They want an AI that resolves their issue instantly or routes them intelligently to the right human, no repetition, no wasted time.

This expectation directly impacts ROI measurement. A deflection statistic that counts a frustrated customer who was forced through 4 AI interactions before screaming "agent!" into the chat is not an ROI-positive outcome. That customer's lifetime value just decreased, even if the ticket was "deflected" from agent time. The 4% measure not just whether AI handled the interaction, but whether it handled it in a way that preserved or enhanced customer value. This is the Sentiment Recovery Rate and Re-contact Rate at work.
From Insight to Action: Your 30-Day ROI Visibility Plan
The journey from the 96% to the 4% doesn't require a complete overhaul. It requires a decisive pivot in what you measure and how you report it. Here's your 30-day plan to establish ROI visibility:
- Week 1: Schedule a 45-minute meeting with your finance partner. Present the 16 metrics framework. Agree on your organization's Financial North Star, the single metric your AI ROI will be judged against.
- Week 2: Document the measurement bridge. For your chosen North Star, define the operational metrics, formulas, and data sources. Identify any baselines you need to establish that don't currently exist. If you need 3 months of historical response time data, start pulling it now.
- Week 3: Implement value-focused reporting. Replace your current AI dashboard's activity metrics with the first 5 value metrics from the framework. If your AI vendor can't provide this data, that's a critical finding, it means your technology partner isn't equipped to help you prove ROI.
- Week 4: Run your first Value Audit. Compare your AI outcomes against your baseline period. Where you can show improvement, document it in financial terms. Where you can't, create a specific optimization plan with a 2-week check-in. Present this audit to your leadership team, even if it's incomplete. Showing the rigor of the measurement process builds more credibility than a polished deck of vanity metrics.
Conclusion: The ROI Gap Is Your Leadership Opportunity
The statistic that launched this exploration, only 4% of customer service teams achieve expected AI ROI, is not a reason to avoid AI. It's a massive competitive opportunity for the leaders who figure out measurement. While your competitors are confusing chatbot interactions with business value, you can build the financial evidence that earns continued investment, expands your AI scope, and transforms your support organization from a cost center narrative to a value driver reality.
The tools exist. The benchmarks exist. The frameworks exist. What's missing in 96% of organizations is the leadership decision to demand financial accountability from AI investment. Close that gap, and you won't just join the 4%, you'll define what the next generation of support leadership looks like.
After all, in a world where only 6.5% of organizations even measure AI against benchmarks, simply having a disciplined ROI measurement protocol in place puts you ahead of 93.5% of the market. That's not just good analytics. That's a career-defining leadership advantage.