
The question every support leader is asking right now: How much of our ticket volume can AI actually resolve without human intervention?
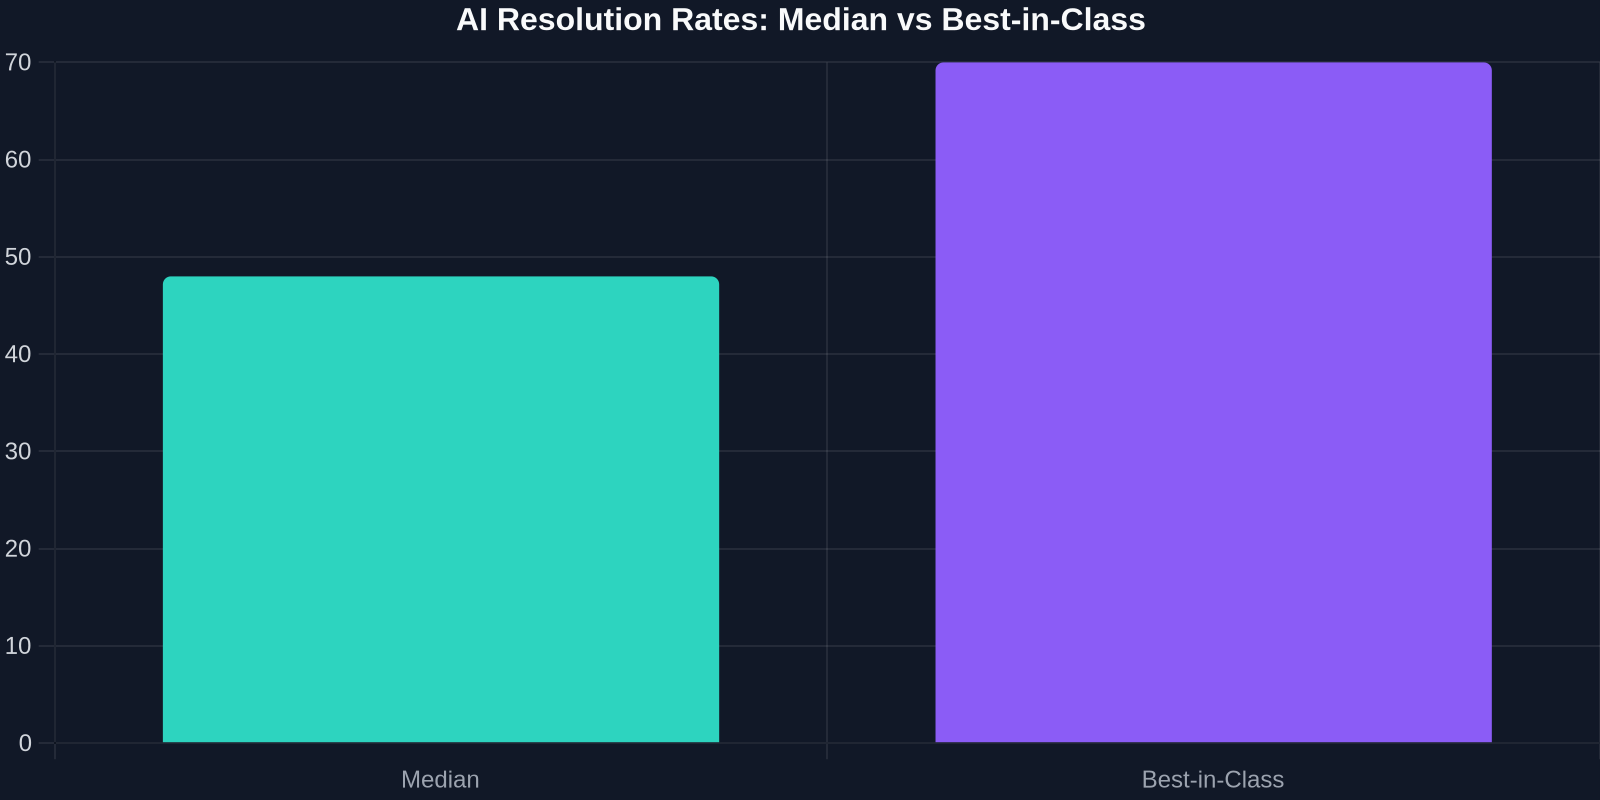
The answer, according to new benchmark data from SaaStr covering 13 leading AI support vendors, is both encouraging and sobering. The best performers are resolving around 70 percent of customer queries end to end, while the median hovers at 48 percent.
That gap of more than 20 percentage points separates market leaders from average performers. For support teams evaluating AI solutions, understanding what drives that variance is the difference between transformative ROI and disappointing results.
What the 13-Vendor Data Actually Tells Us
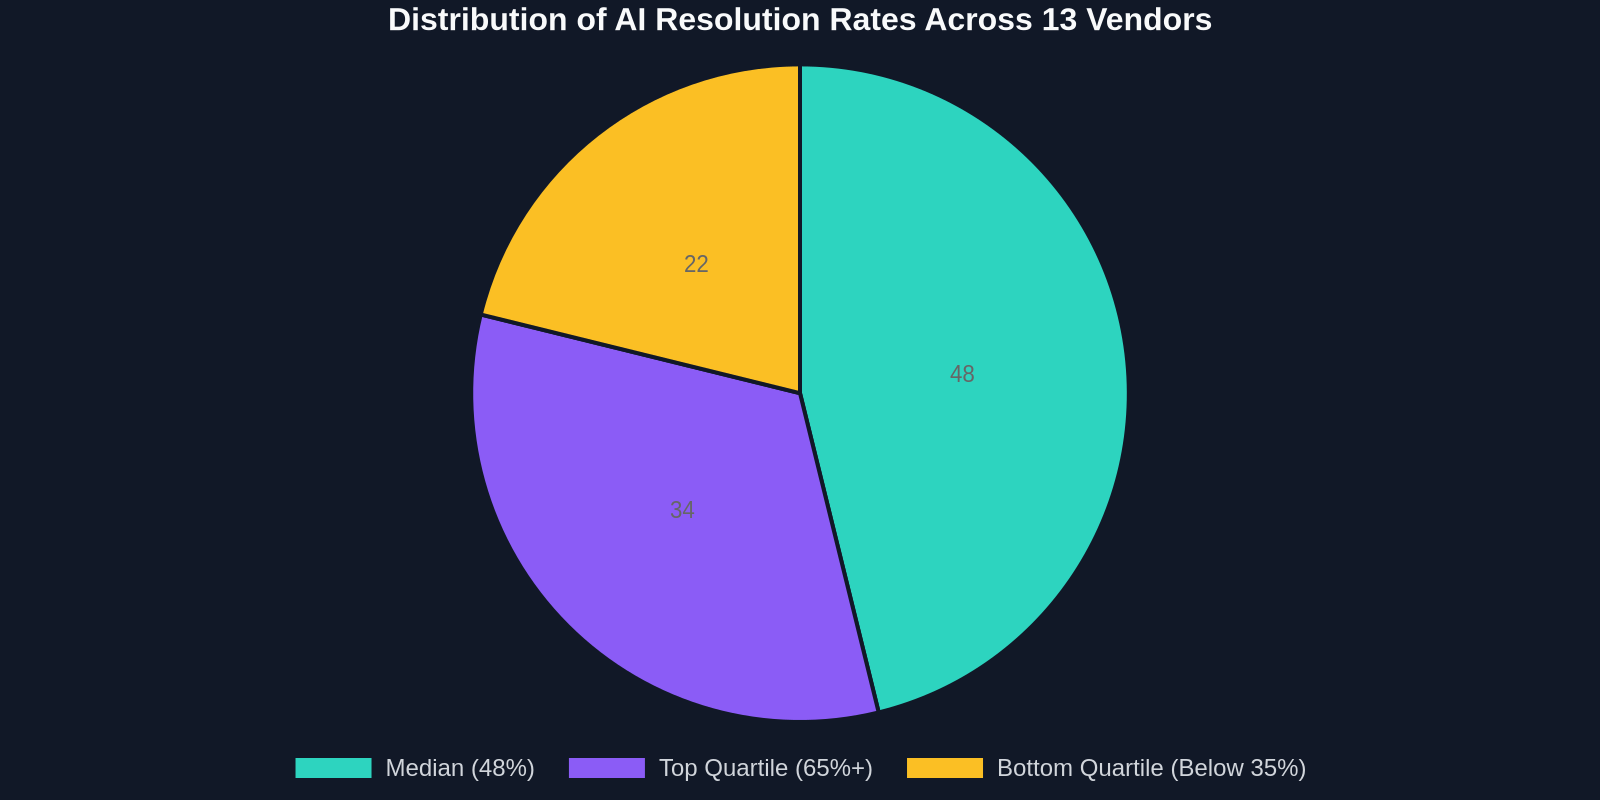
The SaaStr analysis aggregated resolution data across 13 AI customer support vendors, each serving hundreds or thousands of businesses. The headline finding is clear: AI can resolve a substantial portion of support tickets autonomously, but the range is wide.
Gorgias, one of the platforms included in the broader analysis, reports that the median brand using its AI resolves 45 percent of AI-touched tickets end to end, while the top quartile clears 65 percent. LAQO, another vendor in the space, sees its AI chatbot resolve roughly 30 percent of all customer queries without any human involvement, with 90 percent of purchases flowing through messaging channels like WhatsApp and RCS.
Why the Range Is So Wide
When 13 vendors report results ranging from roughly 30 percent to 70 percent, the natural question is what separates the top performers from the rest. The answer involves several intersecting factors:
- Knowledge base quality and structure
- Integration depth with existing systems
- Continuous training and feedback loops
- Clear escalation pathways to human agents
- Scope of use cases initially targeted
Vendors that limit AI to simple FAQ-style questions will cap out around 30 to 35 percent resolution. Teams that expand AI across order management, subscription changes, technical troubleshooting, and even proactive outreach push toward 60 to 70 percent.
What 48 Percent Median Resolution Means for Your P&L
Let us translate the median figure into business terms. If your team handles 10,000 tickets per month and AI can resolve 48 percent autonomously, that is 4,800 tickets that never reach a human agent.

Assume the fully loaded cost per human-handled ticket is $12 when factoring salaries, benefits, tools, and overhead. That monthly savings looks like this:
4,800 tickets x $12 per ticket = $57,600 in monthly savings
Annualized, that comes to approximately $691,000. For a company at the 70 percent resolution level, the annual savings on 10,000 monthly tickets exceeds $1,000,000.
The Real Cost of Not Moving to Top-Quartile Performance
Every month your AI resolution rate sits at 35 percent when it could be at 65 percent, you are leaving significant money on the table. Using the same assumptions as above:
At 35 percent resolution: 3,500 tickets deflected, 6,500 tickets handled by humans
At 65 percent resolution: 6,500 tickets deflected, 3,500 tickets handled by humans
The difference is 3,000 additional tickets per month that require human attention. At $12 per ticket, that is $36,000 in unnecessary monthly spend, or $432,000 per year.
Moving from median to top-quartile AI resolution is not a marginal improvement. It is a six-figure annual difference for mid-sized support teams.
The Gorgias Benchmark: A Deeper Look
Gorgias, which shared granular data as part of this broader vendor analysis, provides one of the most useful breakdowns for ecommerce and SaaS support teams. Their data shows the median brand resolves 45 percent of AI-touched tickets end to end, while the top quartile clears 65 percent.
This is slightly lower than the overall 13-vendor median of 48 percent, likely because Gorgias serves a high volume of ecommerce merchants with complex order, shipping, and returns use cases. Other vendors in the analysis focus more heavily on B2B SaaS support, where query complexity is different.
What Top-Quartile Teams Do Differently
Teams achieving 65 percent or higher resolution rates share common practices:
- They dedicate a knowledge manager to continuously update and improve documentation
- They audit AI conversations weekly and retrain on failure patterns
- They integrate AI with order management, CRM, and billing systems for context-aware responses
- They set clear confidence thresholds for when AI should escalate to humans
- They measure resolution rate, escalation rate, and customer satisfaction separately
- They iterate on conversation flows monthly, not quarterly
| Metric | Bottom Quartile | Median | Top Quartile |
|---|---|---|---|
| AI Resolution Rate | Below 35% | 45-48% | 65-70% |
| Tickets Requiring Humans | 65%+ | 52-55% | 30-35% |
| Typical AI Scope | FAQ and basic answers | FAQ + some workflows | Full order management, billing, technical support |
| Knowledge Base Investment | Low | Moderate | High with dedicated owner |
| Continuous Improvement Cadence | Quarterly or less | Monthly | Weekly |
How to Benchmark Your Own AI Resolution Rate
Before you can improve, you need a baseline. Most support teams do not have a clear picture of what AI currently resolves versus what it escalates. Here is a practical framework:
Step 1: Define Resolution Clearly
Resolution means the customer confirmed their issue was solved without human agent involvement. This is not the same as AI providing a first response. A ticket is only counted as resolved if the customer did not need to escalate and did not reopen the ticket.
Step 2: Segment Your Ticket Categories
Break down your ticket volume into at least five categories:
- Account and billing
- Product or service questions
- Technical troubleshooting
- Order and shipping status
- Returns, refunds, or cancellations
AI resolution rates will vary significantly across these categories. Most platforms resolve order status and FAQ-type questions at very high rates, while technical troubleshooting remains more challenging.
Step 3: Run a 30-Day Measurement Period
Track the resolution rate for each category over 30 days. Do not optimize during this period. You want a clean baseline.
Step 4: Compare Against the 13-Vendor Benchmark
If your overall resolution rate is above 48 percent, you are ahead of the median. If you are above 65 percent, you are in the top quartile. If you are below 35 percent, there is substantial room for improvement that likely starts with knowledge base quality and AI scope expansion.
The ROI Math: From Median to Top Quartile
Let us build a complete ROI model for a support team handling 10,000 tickets per month at an average cost of $12 per human-handled ticket.
Current State: Median Performance at 48 Percent
- AI-resolved tickets: 4,800 per month
- Human-handled tickets: 5,200 per month
- Monthly human support cost: $62,400
- Annual human support cost: $748,800
Target State: Top-Quartile Performance at 65 Percent
- AI-resolved tickets: 6,500 per month
- Human-handled tickets: 3,500 per month
- Monthly human support cost: $42,000
- Annual human support cost: $504,000
Annual Savings: $244,800
That $244,800 in savings does not include additional benefits like 24/7 coverage without overtime costs, faster response times leading to higher customer satisfaction, or the ability to reallocate human agents to high-value interactions that drive retention and expansion revenue.
AI support is not just a cost play. It is a customer experience play. Faster resolutions at scale drive retention metrics that compound over time.
Common Mistakes That Cap AI Resolution Below the Median
Why do some teams struggle to hit even the 48 percent median? The patterns are consistent across companies that underperform:

Mistake 1: Treating AI as a Widget
Teams that buy an AI tool, turn it on, and expect magic will be disappointed. AI resolution rates improve through deliberate iteration, knowledge base investment, and ongoing training. The tool is necessary but not sufficient.
Mistake 2: Poor Knowledge Base Hygiene
If your help center articles are outdated, contradictory, or written in dense prose, the AI will struggle regardless of how sophisticated the underlying model is. Garbage in, garbage out applies.
Mistake 3: No Escalation Strategy
AI that confidently provides wrong answers erodes trust. Teams that fail to set confidence thresholds or create smooth escalation paths end up with frustrated customers and agents who distrust the AI, leading to lower adoption and lower resolution rates.
Mistake 4: Measuring the Wrong Metrics
Teams that optimize for deflection without measuring customer satisfaction or resolution quality will inflate short-term numbers while damaging long-term customer relationships. Resolution must mean the customer is actually satisfied, not just that no human was involved.
Building Your Path to 70 Percent Resolution
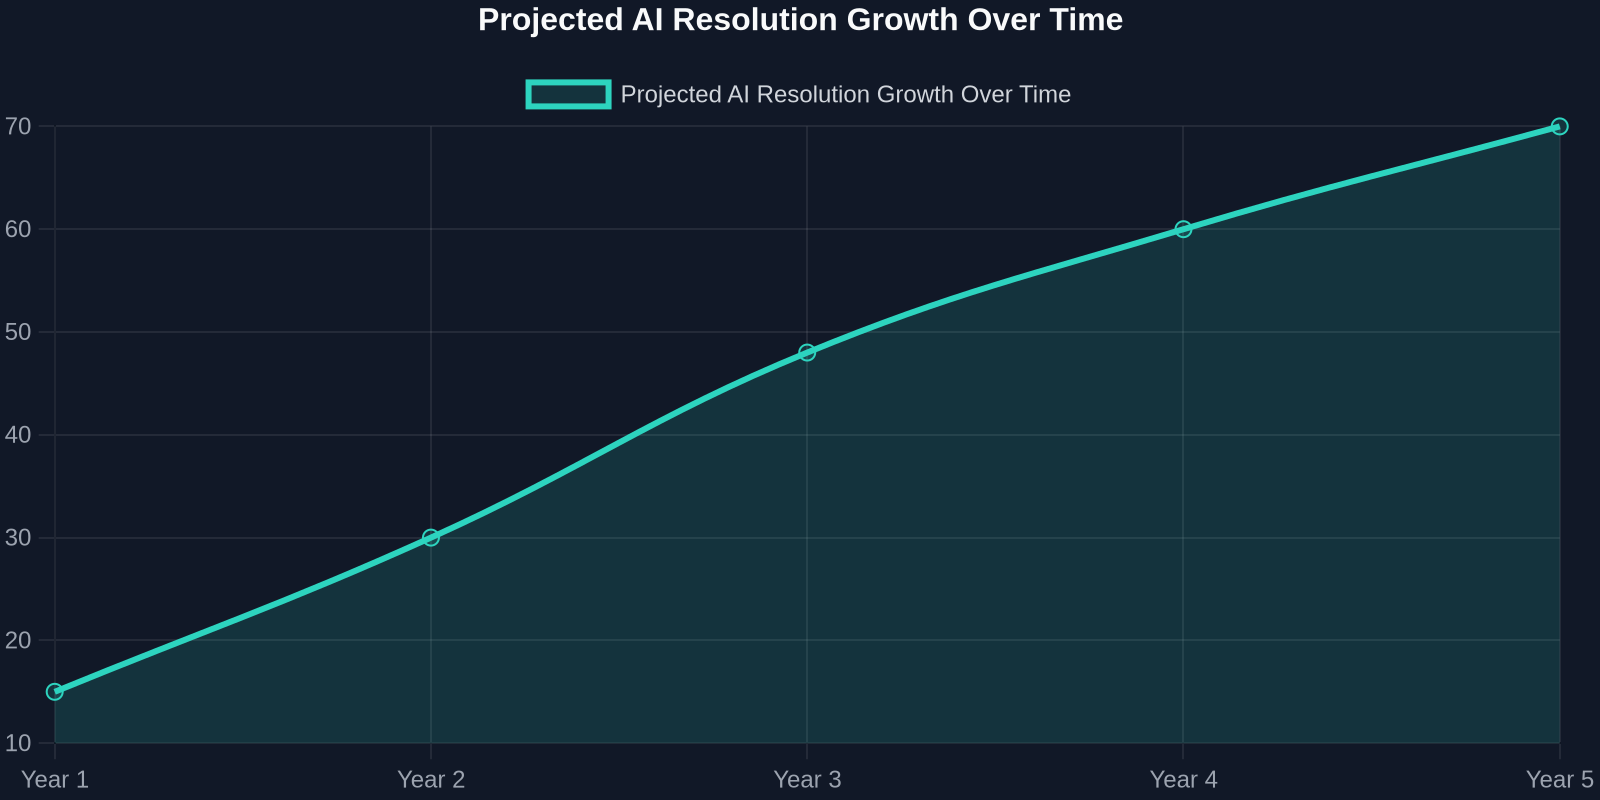
Achieving best-in-class AI resolution is a multi-quarter journey. Here is a phased approach that aligns with how top-quartile teams actually got there:
Phase 1: Foundation (Months 1-2)
Target: 30-35 percent resolution
- Audit and clean your knowledge base
- Deploy AI on high-confidence, low-complexity categories like order status and account FAQs
- Establish escalation protocols
- Train your team on AI oversight and collaboration
Phase 2: Expansion (Months 3-6)
Target: 45-50 percent resolution
- Expand AI to billing inquiries, subscription changes, and basic troubleshooting
- Integrate AI with order management and CRM systems for context-aware responses
- Begin weekly conversation audits to identify failure patterns
- Refine confidence thresholds based on real-world data
Phase 3: Optimization (Months 6-12)
Target: 60-70 percent resolution
- Expand into complex troubleshooting with guided workflows
- Enable proactive AI outreach for common issues (shipping delays, payment failures)
- Move to weekly retraining cycles with dedicated knowledge management
- Implement customer sentiment analysis to catch edge cases early
What Successly Brings to the Table
As you evaluate AI support platforms against the 13-vendor benchmark data, the key question is not whether AI can resolve tickets, but whether a specific platform can move your team toward top-quartile performance.
Successly is built for support operations teams that want to move beyond basic FAQ automation and into true end-to-end resolution. The platform combines AI-powered ticket triage, context-aware response generation, and seamless human handoff. Teams using Successly consistently report resolution rates in the 60-70 percent range when following the implementation phases outlined above.
The difference comes down to depth of integration and ongoing optimization support. Successly connects to your knowledge base, order management, billing, and CRM systems so the AI has the context needed to resolve complex queries without human intervention. And the platform includes built-in analytics to track resolution rate, escalation rate, and customer satisfaction as separate signals, allowing continuous improvement without tradeoffs.
The Bottom Line for Support Leaders
The 13-vendor benchmark data from SaaStr provides a critical reference point for support leaders evaluating AI. The median resolution rate of 48 percent is a realistic expectation for teams that invest moderately in AI support. The best-in-class figure of 70 percent demonstrates what is possible with a strategic approach.
The gap represents an opportunity. Teams that treat AI support as a core operational capability, invest in knowledge base quality, expand AI scope deliberately, and measure resolution with customer satisfaction as a guardrail will outperform the median. Those that treat AI as a quick fix will fall below it.
The question is no longer whether AI can handle customer support. The data is clear: it can, and it already does for thousands of companies. The question is whether your team will be in the median cohort or the top quartile. The difference is measured in six figures for most support organizations, and millions for enterprise-scale teams.